As part of a Problem Solving Course that I teach, I have several sessions on probability theory. Given that attorneys must frequently make decisions in environments of uncertainty, probability can be a useful skill for law students to learn.
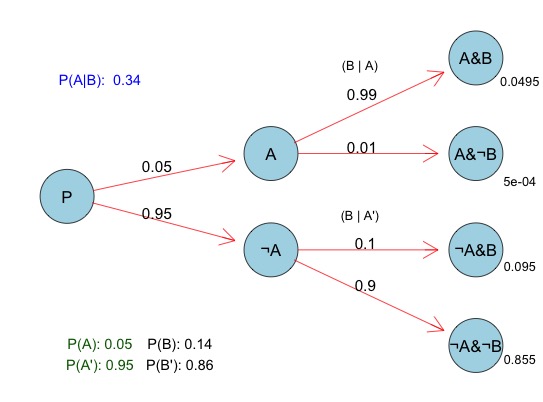
Conditional probability, and Bayes’ Theorem, are important sub-topics that I focus upon. In teaching my students about Conditional Probability, it is often helpful to create a Conditional Probability Tree diagram like the one pictured below (sometimes called a probability tree). I’ll explain in a future post why such a diagram/graph is a useful visualization for learners.
(See also this Javascript Conditional Probability Tree Diagram webpage that I created in that I describe in a different post.)
Conditional Probability Tree Diagram
No Probability Tree Diagrams in R ?
Like many others, I use the popular free, and open-source R statistical programming language. R is one of the top computing platforms in which to perform machine learning and other statistical tasks (along with Python – another favorite of mine). To program in R, I use the excellent R-Studio application which makes the experience much better.
Given the relationship between R and statistics, I was somewhat surprised that I was unable to find any easily accessible R code or functions to create visually appealing Conditional Probability Tree diagrams like the one above.
Thus, I put together some basic R code below for visualizing conditional probability trees, using the Rgraphviz R package. You must install the Rgraphviz package before using the R code below. If you know of other ways to create visually appealing conditional probability tree in R that I may have missed in my search, please let me know.
I thought I’d release the code below to others in case it is useful.
(Caveat: This is rough code, and has not been thoroughly tested, and is just meant as a starting example to help make your own probability tree diagrams – so no guarantees).
(You can also look at this other post about creating a Probability Tree Diagram Using Javascript and D3 if R is not your preferred platform.)
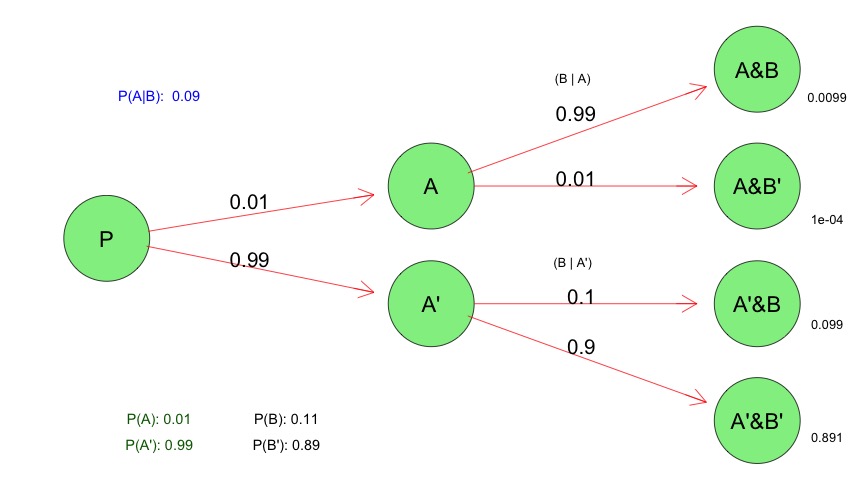
R Code to Create a Visual Conditional Probability Tree
# R Conditional Probability Tree Diagram

# The Rgraphviz graphing package must be installed to do this
require("Rgraphviz")

# Change the three variables below to match your actual values
# These are the values that you can change for your own probability tree
# From these three values, other probabilities (e.g. prob(b)) will be calculated

# Probability of a
a<-.01

# Probability (b | a)
bGivena<-.99

# Probability (b | ¬a)
bGivenNota<-.10

###################### Everything below here will be calculated

# Calculate the rest of the values based upon the 3 variables above
notbGivena<-1-bGivena
notA<-1-a
notbGivenNota<-1-bGivenNota

#Joint Probabilities of a and B, a and notb, nota and b, nota and notb
aANDb<-a*bGivena
aANDnotb<-a*notbGivena
notaANDb <- notA*bGivenNota
notaANDnotb <- notA*notbGivenNota

# Probability of B
b<- aANDb + notaANDb
notB <- 1-b

# Bayes theorum - probabiliyt of A | B
# (a | b) = Prob (a AND b) / prob (b)
aGivenb <- aANDb / b

# These are the labels of the nodes on the graph
# To signify "Not A" - we use A' or A prime

node1<-"P"
node2<-"A"
node3<-"A'"
node4<-"A&B"
node5<-"A&B'"
node6<-"A'&B"
node7<-"A'&B'"
nodeNames<-c(node1,node2,node3,node4, node5,node6, node7)

rEG <- new("graphNEL", nodes=nodeNames, edgemode="directed")
#Erase any existing plots
dev.off()

# Draw the "lines" or "branches" of the probability Tree
rEG <- addEdge(nodeNames[1], nodeNames[2], rEG, 1)
rEG <- addEdge(nodeNames[1], nodeNames[3], rEG, 1)
rEG <- addEdge(nodeNames[2], nodeNames[4], rEG, 1)
rEG <- addEdge(nodeNames[2], nodeNames[5], rEG, 1)
rEG <- addEdge(nodeNames[3], nodeNames[6], rEG, 1)
rEG <- addEdge(nodeNames[3], nodeNames[7], rEG, 10)

eAttrs <- list()

q<-edgeNames(rEG)

# Add the probability values to the the branch lines

eAttrs$label <- c(toString(a),toString(notA),
 toString(bGivena), toString(notbGivena),
 toString(bGivenNota), toString(notbGivenNota))
names(eAttrs$label) <- c(q[1],q[2], q[3], q[4], q[5], q[6])
edgeAttrs<-eAttrs

# Set the color, etc, of the tree
attributes<-list(node=list(label="foo", fillcolor="lightgreen", fontsize="15"),
 edge=list(color="red"),graph=list(rankdir="LR"))

#Plot the probability tree using Rgraphvis
plot(rEG, edgeAttrs=eAttrs, attrs=attributes)
nodes(rEG)
edges(rEG)

#Add the probability values to the leaves of A&B, A&B', A'&B, A'&B'
text(500,420,aANDb, cex=.8)

text(500,280,aANDnotb,cex=.8)

text(500,160,notaANDb,cex=.8)

text(500,30,notaANDnotb,cex=.8)

text(340,440,"(B | A)",cex=.8)

text(340,230,"(B | A')",cex=.8)

#Write a table in the lower left of the probablites of A and B
text(80,50,paste("P(A):",a),cex=.9, col="darkgreen")
text(80,20,paste("P(A'):",notA),cex=.9, col="darkgreen")

text(160,50,paste("P(B):",round(b,digits=2)),cex=.9)
text(160,20,paste("P(B'):",round(notB, 2)),cex=.9)

text(80,420,paste("P(A|B): ",round(aGivenb,digits=2)),cex=.9,col="blue")
Another Probability Tree Example in Light Blue with (¬ sign)