Category Archives: Visualization

Exploring the Constitution Visually

I have developed a new experimental interactive app for exploring the United States Constitution.

US Constitution Explorer

conaminationOnce

Click on the image above to launch the app

This app allows you to navigate the contents of the U.S. Constitution while displaying the overall hierarchy and structure. You can click on the various Articles and Amendments to expand the sub-parts and and see the accompanying text.

Consitution List2

This app was somewhat more challenging to develop because I was unable to find any version of the U.S. Constitution that had been written in .xml.  Thus, I had to create an .xml version of the Constitution myself.  In a follow-up post, I will include the xml version of the U.S. Constitution

This app was created using the d3 data visualization framework and javascript.  It uses Mike Bostock’s collapsible tree framework as a base.

Interactive Visualizations of U.S. Law

circleExploded

Recently I created two different interactive apps visualizing and exploring the Titles of the U.S. Code.  You can browse the text of Title 35 (Patent) and Title 17 (Copyright) in a visually interesting manner. Click on the photos below to use them.

Tree Layout Visualization

US Code Explorer Screen shot

Force Directed Graph Visualization

Copyright Circles

D3, Javascript, .xml

These layouts were created using the d3 data visualization framework, javascript, and xml.  They take advantage of the fact that the Titles of the U.S. Code have been released in .xml.

More explanations can be found in blog posts here and here.

Visualizing US Law – Force Directed Graph

circleExploded

I have created a new experimental app for visualizing and exploring U.S. Law using a force-directed graph.  You can click on the picture above to launch it. This force-directed visualization is more intended to be visually interesting rather than a full-fledged U.S. law navigation tool.

This is the second in a series of data visualizations of US Federal Law that I am creating using the d3 data visualization framework and javascript.  The first data visualization is located here.

Explore the Copyright Code or the Patent Code

This app allows you to explore two titles of the US Code.

Title 17 – The Copyright Code

Copyright Circles

Title 35 – The Patent Code

Patent Circles

Hub and Spoke Representation of US Code Hierarchy

The chart uses a “hub and spoke” layout to represent the hierarchy of a given Title of the U.S. Code such as Title 35.  The center circle represents a “parent” portion of the code – a portion with sub-portions under it (e.g. Chapter 10) and the surrounding circles on the edge represent the “children” portions that belong to that parent (Section 100, Section 101, section 103..).

Screen Shot 2015-04-28 at 5.03.31 PM

You can click on an outer circle to open up the “children” parts that reside under that circle.  If a circle has “children” parts, the circle border will be a thick grey.  The selected circle will then be the new “parent”, and its “children” portions will be displayed.

Force Directed Graph

The app uses a “force directed graph” engine to display the titles of the U.S. Code.  Force directed graphs are often used to model interactions between physical objects, such as molecules reacting to gravity.  Because force directed graphs such as this simulate physical forces such as gravity, using this framework to display data means that various parts can tend to move around somewhat randomly.
Continue reading

Visualizing the US Code -Part 1: Law Explorer

US Code Explorer: Title 35 (Click to Use)

Visualizing the US Code: Law Explorer

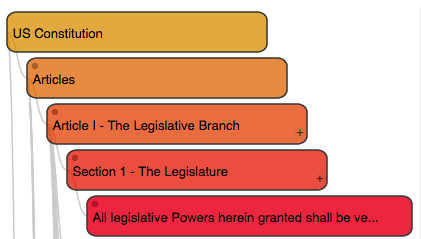
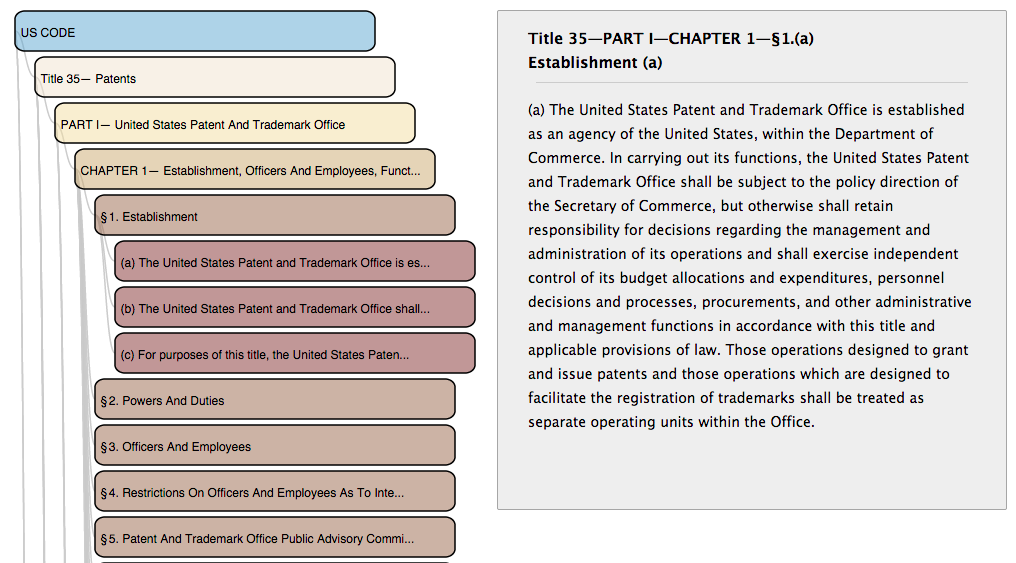
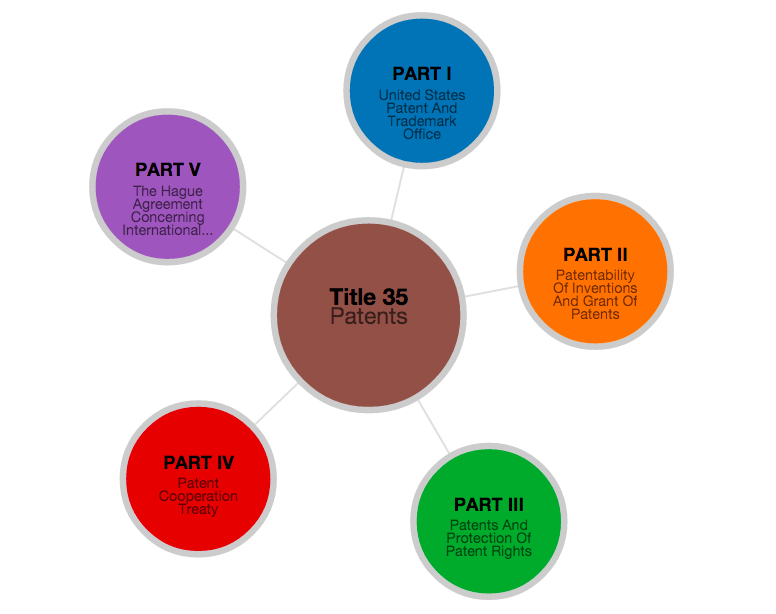
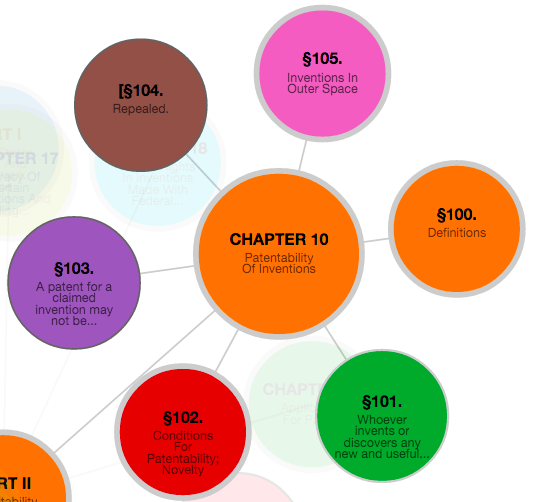
I have created a new demonstration application for visualizing and browsing the US Code – the US Code Explorer (beta) (pictured above).  Click on the link or photo to see it in action.

The app is meant as an experiment in visualizing and interacting with the US Code since it has been marked-up in xml by the federal government.

I selected Title 35 (Patent Law) as my example.

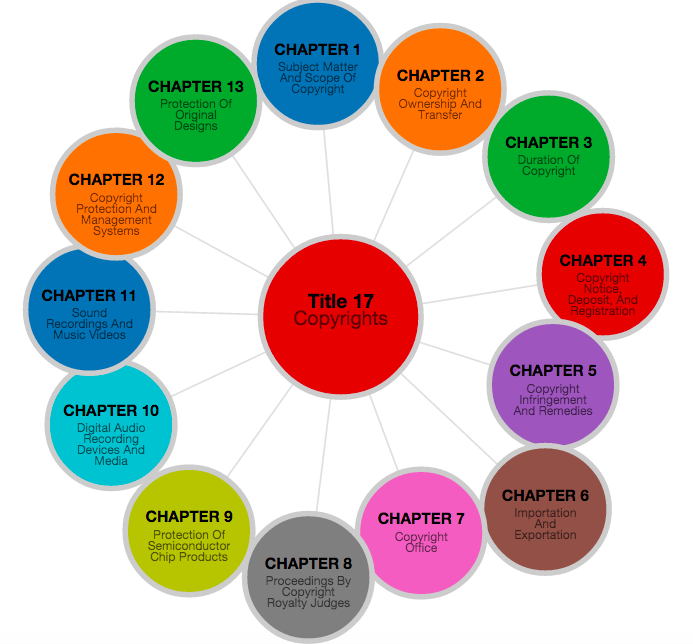
There is also a second version with three Titles of the US code: Title 35 (Patents), Title 17 ( Copyright), and Title 20 (Education).  Due to the size, the second version takes a bit longer to load.

Screen Shot 2015-04-01 at 9.22.04 PM

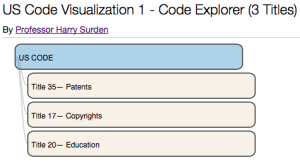
Version with Multiple Titles: Title 35, Title 17, Title 20

The look and presentation of the visualization parallels the visual style that that I use when I present the law to my students when I teach Patent Law and Introduction to Intellectual Property.  During class, the visualizations are static Powerpoint slides.  This is a more interactive version.

Please note – this is merely a beta version of this visualization.  Neither the computer code, nor the US code, have been thoroughly tested.  Please do not rely on this app for the law as there may be errors or omissions.

I will have a follow up post explaining in more depth what I did, but in short, I wrote a parser in python to read through the US Code xml files and extract the law hierarchy from the titles.  I then exported the structure in .json format.

And finally, I used the amazing d3 data visualization framework to create the visualization.  Here, I borrowed heavily and employed a modified version of Mike Bostock’s d3 collapseable hierarchical tree.

This is the first is a series of data visualization experiments of the US Code that I will employ using the d3 framework.  The projects will be found in here.