Author Archives: Harry Surden

Harry Surden is an Professor of Law at the University of Colorado Law School and affiliated faculty at the Stanford Center for Legal Informatics (CodeX). His scholarship centers upon artificial intelligence and law, patents and copyright, information privacy law, legal informatics and legal automation, and the application of computer technology within the legal system. He is a former professional software engineer. His Twitter is : @Harry Surden

ChatGPT, Large Language AI Models, and Making Law More Accessible

This is the first in a series of posts about how we can use new artificial intelligence (AI) in Large Language Models to interact with and understand the law.

No doubt many of us have interacted with ChatGPT or at least of heard it by now. If not, ChatGPT (and similar technologies) represent one of the biggest leaps in Artificial Intelligence (AI) that I have seen in more than 20 years of studying the field. (I am writing a series of separate posts explaining the underlying technology behind ChatGPT, so I won’t go into that here). ChatGPT is an example of Large Language Model (LLM) technology that has been trained with reinforcement learning to respond to human intent, and it is quite remarkable.

In this post, I want to quickly illustrate some of the potential benefits that ChatGPT (and it’s close cousin BingChat) can have on making the law more understandable to the non-lawyers.

Below is an example of a law – it comes from my home town, the City of Boulder Colorado, and it describes the rules surrounding the qualifications to be elected to Boulder City Council.

As you can see, even what should be a seemingly simple set of rules is written in “legalese” and would be difficult for a lay person to actually understand.

“No person shall be eligible to office as council member or mayor unless, at the time of the election, such person is a qualified elector as defined by the laws of the State of Colorado, at least twenty-one years of age, and shall have resided in the City of Boulder for one year immediately prior thereto.”

By contrast, lawyers are trained to parse and understand such obscure legal language, and can, with some difficulty, make sense of it.

However, ChatGPT, and new, similar LLM AI technology are now sometimes able to make law much more understandable to lay people without the need to consult a lawyer. This is perhaps not such great news for lawyers (and law professors like me who train lawyers), but overall is quite good for society, and the many people who are governed by laws they struggle to understand.

I decided to input this section of the Boulder Municipal Code into ChatGPT to see if it could cut through the legal jargon and produce a short and understandable summary.

ChatGPT did a great job and produced what I would consider a very understandable synthesis.

As you can see (above), ChatGPT “read” the law that I gave it, and followed my “prompt”, and produced understandable bullet points that accurately summarize the legal rules in that code. All one has to do currently is “copy” the law and then “paste” it into ChatGPT attaching first a ChatGP prompt similar to mine, such as,

Prompt: “The following is a law. Summarize all of the conditions. Express each condition in a bullet point on it’s own line.”

Now ChatGPT and similar technology are still relatively in their infancy. And it is not too hard to imagine having a AI LLM “companion” on the web translating difficult-to-understand legal text that people encounter as they browse the web, into bullet points that are understandable by the 99% of society who are not lawyers.

We may be not too far from that point right now. As some may have heard, Microsoft has integrated a slightly more advanced version of ChatGPT into it’s Bing Search and Edge Browser (available only to those who sign up for a research preview and get off the waitlist).

Below is an example of Microsoft’s Edge Browser which has Bing Chat (i.e., advanced ChatGPT) directly integrated into the browser. You can give the BingChat Browser extension permission to “peer” into whatever web page you are on, and ask it questions about that page.

Here, I am on the City of Boulder Municipal Web Page, and I am able to ask it to summarize the different parts of the laws in bullet points. It does a terrific job, and produced results similar to ChatGPT.

Of course, this is just early days, and there will certainly be issues with accuracy, etc. But I think this shows a glimpse of a hopeful future in which modern AI can make the law more accessible and understandable to non lawyers, many of whom today are without any access to lawyers, or ability to understand the laws that govern them.

The U.S. Constitution in XML

One of the more challenging aspects in creating the interactive app for exploring the United States Constitution was the lack of an XML version of the U.S. Constitution.

US Constitution Explorer

conaminationOnce

Click on the image above to launch the app


I looked around on the web a bit, but I was unable to find one.  (Perhaps I missed it, please let me know).  This in contrast to the Titles of the U.S. Code which have been released in .xml Format.

(Edit: Update – Some time after I wrote this, Congress released an Official version of the US Constitution in xml – located here.  You may prefer that to my unofficial version below.)

Structuring the law as data in XML (or some other structured format) is what permits us to create interesting visualizations like the above, or those here and here.

US Constitution in XML

Constitution in XML

Thus, I decided to create versions of the U.S. Constitution in XML and JSON (Javascript Object Notation) format.  The text of the Constitution was copied from this source.  I wrote a parser in python to read in the plain text file and create the xml and JSON files based upon the heading structure.

You can download this version of the U.S. Constitution in XML from github or simply copy from below.  Please note, this is just a “beta” version.  I haven’t fully vetted the contents of the Constitution that I copied, and while I believe it to be correct, there may be errors.  Please feel free to copy it and adapt it for your own purposes.
Continue reading

Exploring the Constitution Visually

I have developed a new experimental interactive app for exploring the United States Constitution.

US Constitution Explorer

conaminationOnce

Click on the image above to launch the app

This app allows you to navigate the contents of the U.S. Constitution while displaying the overall hierarchy and structure. You can click on the various Articles and Amendments to expand the sub-parts and and see the accompanying text.

Consitution List2

This app was somewhat more challenging to develop because I was unable to find any version of the U.S. Constitution that had been written in .xml.  Thus, I had to create an .xml version of the Constitution myself.  In a follow-up post, I will include the xml version of the U.S. Constitution

This app was created using the d3 data visualization framework and javascript.  It uses Mike Bostock’s collapsible tree framework as a base.

Interactive Visualizations of U.S. Law

circleExploded

Recently I created two different interactive apps visualizing and exploring the Titles of the U.S. Code.  You can browse the text of Title 35 (Patent) and Title 17 (Copyright) in a visually interesting manner. Click on the photos below to use them.

Tree Layout Visualization

US Code Explorer Screen shot

Force Directed Graph Visualization

Copyright Circles

D3, Javascript, .xml

These layouts were created using the d3 data visualization framework, javascript, and xml.  They take advantage of the fact that the Titles of the U.S. Code have been released in .xml.

More explanations can be found in blog posts here and here.

Visualizing US Law – Force Directed Graph

circleExploded

I have created a new experimental app for visualizing and exploring U.S. Law using a force-directed graph.  You can click on the picture above to launch it. This force-directed visualization is more intended to be visually interesting rather than a full-fledged U.S. law navigation tool.

This is the second in a series of data visualizations of US Federal Law that I am creating using the d3 data visualization framework and javascript.  The first data visualization is located here.

Explore the Copyright Code or the Patent Code

This app allows you to explore two titles of the US Code.

Title 17 – The Copyright Code

Copyright Circles

Title 35 – The Patent Code

Patent Circles

Hub and Spoke Representation of US Code Hierarchy

The chart uses a “hub and spoke” layout to represent the hierarchy of a given Title of the U.S. Code such as Title 35.  The center circle represents a “parent” portion of the code – a portion with sub-portions under it (e.g. Chapter 10) and the surrounding circles on the edge represent the “children” portions that belong to that parent (Section 100, Section 101, section 103..).

Screen Shot 2015-04-28 at 5.03.31 PM

You can click on an outer circle to open up the “children” parts that reside under that circle.  If a circle has “children” parts, the circle border will be a thick grey.  The selected circle will then be the new “parent”, and its “children” portions will be displayed.

Force Directed Graph

The app uses a “force directed graph” engine to display the titles of the U.S. Code.  Force directed graphs are often used to model interactions between physical objects, such as molecules reacting to gravity.  Because force directed graphs such as this simulate physical forces such as gravity, using this framework to display data means that various parts can tend to move around somewhat randomly.
Continue reading

Probability Tree Diagrams Using D3 and Javascript

Probability Tree Diagram

Screen Shot 2015-04-21 at 11.02.20 AM

Click on Tree Image to Use Interactive App

This post will discuss an Interactive Conditional Probability Tree Diagram that I created and how and why to do it.

Conditional Probability and Probability Trees

I include some basic probability theory as part of a Problem Solving Course that I teach to law students.  Probability can be a useful skill for law students to learn given that attorneys are often called upon to make decisions in environments of uncertainty.

In teaching my students about Conditional Probability, it is often helpful to create a Conditional Probability Tree diagram like the one pictured above. Probability Tree diagrams can help the students visualize the branching structure of conditional probability.

Probability Tree Diagrams Using D3 and Javascript

To create the interactive conditional probability tree diagram, I used the excellent D3 Data Framework and Javascript.


Screen Shot 2015-04-21 at 11.02.40 AM


The diagram automatically computes the relevant conditional probabilities given the input data.  It also allows you to change the input probabilities and recompute.
Continue reading

Structuring US Law: Part 1

The U.S. Code – (the primary collection of Federal Statutory Law) – has become structured. It always had an implicit structure. However, since 2013 it has had an explicit, machine-readable structure.


US Code Explorer Screen shot

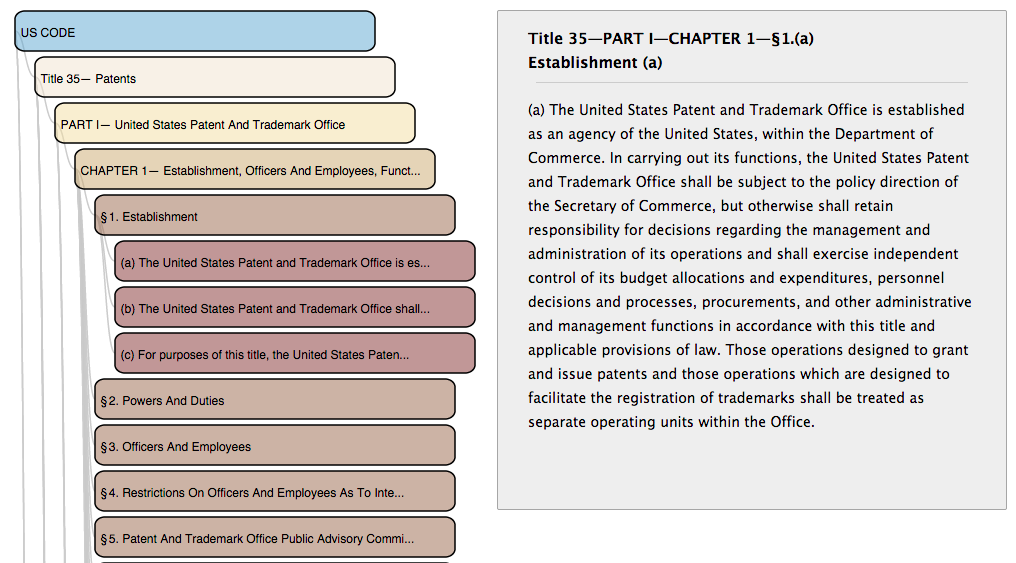
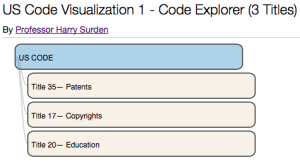
US Code Explorer – Click to Open Explorer

The explicit structuring of the U.S. law allows for increased computational analysis and visualization of the law, like this experimental demonstration app for navigating and visualizing the Titles of the U.S. Code that I recently created.

This post will discuss what it means for US law to be structured and why this enabled increased data analysis and visualization.

Structured Law and Computer Analysis

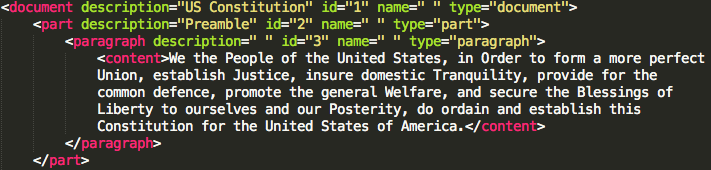
Around 2013, the U.S. government released the United States Code – in xml (extensible markup language) format. Releasing the laws in “.xml” means that the federal laws have now been given an explicit structure that can be read by computers.

To see why explicitly structuring the law in “machine-readable” form allows for more advanced computer analysis, let’s first examine the concept of explicit computer-readable structure and what this has to do with law.

The Structure of the United States Code

Most of the laws that the US Congress passes are collected in the US Code which is a large compilation of federal statutory law.

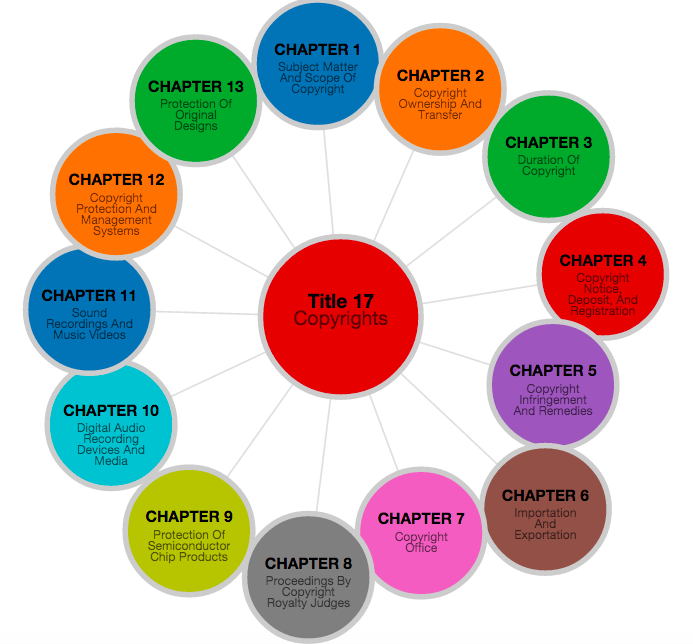
The US Code has a structure. At the highest structural level, the Federal Laws are divided into over 50 “Titles”.

Title 15 - Commerce and Trade
.. 
Title 25 - Internal Revenue Code
..
Title 35 - Patent Law

Loosely speaking, a “Title” corresponds to a different topical area for lawmaking. For instance, Title 35 contains most of the the Patent Laws, Title 20 contains many of the Education Laws. (Note that some Titles are a hodgepodge of unrelated topics housed under one document – e.g. Title 15 – Commerce and Trade, and the laws regulating some topics are found across multiple titles). However, the fact that laws are loosely placed by topic within Title is one form of overall structure.

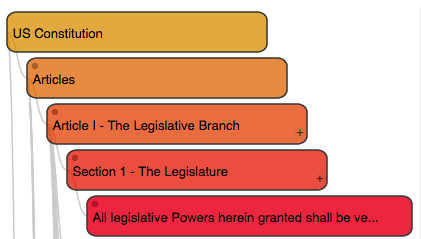
Title Hierarchy: Parts -> Chapters -> Sections

Each Title, in turn, has its own structure and hierarchy. Every title is divided into smaller parts and sections in different levels. A typical structure of a title of the US code will have it divided into

Chapters, Sub-Chapters, Parts

Sections, Sub-Sections, Paragraphs

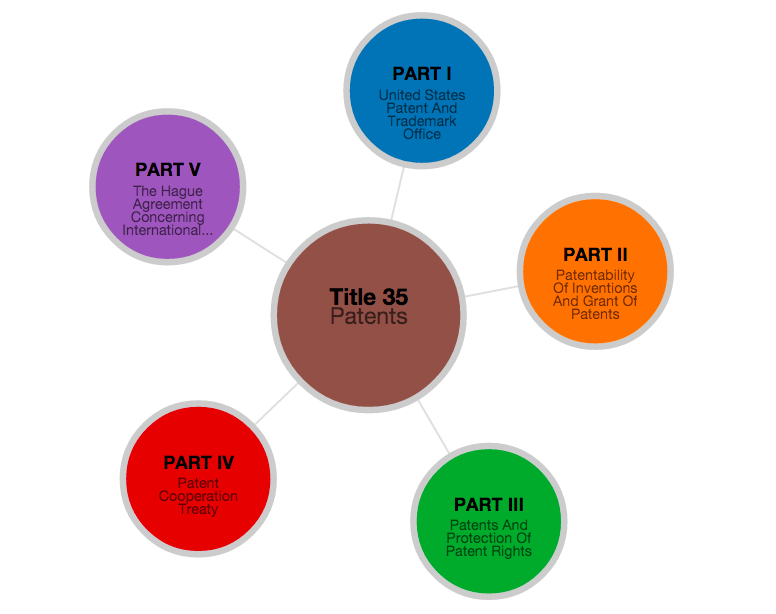
and so on. For instance, Title 35 – the Patent Code – has multiple patent laws located located in different parts of the overall hierarchy. Those laws related to the Patentability of Inventions in Chapter 10, etc.

Title 35 - Patents
  Part 1 -United States Patent And Trademark Office
     CHAPTER 1— Establishment, Officers And Employees
     CHAPTER 2— Proceedings In The Patent And Trademark Office
        § 21. Filing Date And Day For Taking Action
  ....
  Part 2 -Patentability Of Inventions And Grant Of Patents
  ... 
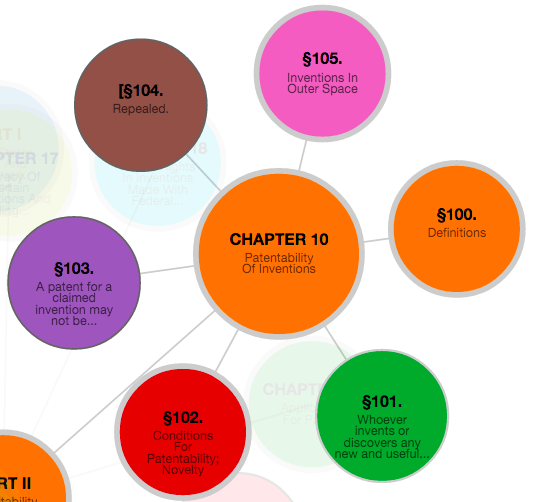
     CHAPTER 10— Patentability Of Inventions
        § 100. Definitions
        § 101. Inventions Patentable

Where is the law that tells us what types of inventions are patentable? That is located in Section 101 – “Inventions Patentable”. Within the overall hierarchy of Title 35, it’s located in Title 35 – Part 2 – Chapter 10 – Section 101.

Title 35
  Part 2
    Chapter 10
      Section 101

And the text of section 101 is

TITLE 35 – PATENTS
SECTION §101 – Inventions patentable Whoever invents or discovers any new and useful process, machine, manufacture, or composition of matter, or any new and useful improvement thereof, may obtain a patent therefor, subject to the conditions and requirements of this title.

Plain Text Law: Unstructured Text

The section just presented is an example of what might be called an “unstructured” (really “semi-structured”, but henceforth “plain text”) version of the law. A “plain text” version of the law means that the law as we normally see it written – in ordinary sentences designed for people to read (as opposed to computers).

SECTION §101 Whoever invents or discovers any new and useful process, machine, manufacture, or composition of matter…

I used the phrase “designed for people to read” to emphasize a point: such a plain text sentence may not be easy for computers to read. Computers are likely to find laws written in plain-text – like the one above – difficult to read. “Plain text” can be contrasted against machine-readable” text, like the example below.

<section number="101">
 <sectionText>
   Whoever invents or discovers any new and useful process,
  machine, manufacture, or composition of matter
 </sectionText>
</section>

Computers prefer text to be rigidly structured and precisely labeled in this way. Such text is “structured” (and machine-readable) because a computer can, following rigid rules, methodically go through and unambiguously identify each part. In the example above, there is legal language within <sectionText>, and the computer knows exactly where the <sectionText> language begins and where it ends.

Plain Text Law: Implicit Structure

A typical law written as plain text does have a structure, but that structure is implicit. The structure includes what legal text goes with what section (i.e. do the words “Whoever invents a new..” go with Section 101 or Section 102), and the hierarchy (i.e. What parts are under what other parts – does Section 101 belong under Chapter 10 or Chapter 11). Let’s understand why the structure of a plain-text law is implicit and therefore difficult for computers to read.

TITLE 35 - PATENTS - Part II - Chapter 10
SECTION §101 - Inventions patentable Whoever invents or discovers any new and useful process, machine, manufacture, or composition of matter, or any new and useful improvement thereof, may obtain a patent therefor, subject to the conditions and requirements of this title.

If you’re an attorney, you might be thinking, “There is an obvious structure in the law above – it is divided up into chapters, sections, etc. I can see that plainly.” If an attorney were to look at a printout of Title 35, she could see that it is divided into 5 “Parts”, each “Part” contains multiple “Chapters”, each “Chapter” in turn contains “Sections”, etc.) However, nothing in a printout of Title 35 that explicitly tells us about the hierarchy and organization of sections. There is nothing explicitly in the document that says, “A ‘Part’ is above a ‘Chapter’, and a ‘Chapter’ is above a ‘Section’.

Rather, that organization is implicit in the way the text is displayed and labeled given legal conventions. Attorneys learn to parse this hierarchy by relying upon common conventions about how law is labeled and structured, and general legal knowledge. Attorneys from training and experience – understand that in federal law there is a structure, and that “Chapters” come below “Parts” in the hierarchy, and that “Sections” are contained within “Chapters”.

Visual Cues and Implicit Structure of Law

In looking at the law, we also rely upon visual clues to show what portions are sub-parts of other portions. Often, when the law is printed, it is indented by several spaces each new level in order to make the hierarchy apparent, and sometimes emphasis like bold, etc, are used.

Screen Shot 2015-04-09 at 11.46.42 AM

Additionally, we rely on visual cues to understand the different elements (e.g. headings vs. text of the law), and where one element begins and another ends. For instance, in looking at the above plain text printing of Title 101, we understand that the heading of the section is “Inventions Patentable”, and that the heading ends with the word “Patentable” where the bolded text ends. Thanks to bolding and spacing, we under that the text of the section begins with “Whoever invents…” The change in formatting and spacing indicates visually where the heading begins, and the content ends.

Unstructured Law: Difficult For Computers

The implicit structure in “plain text” sentences – like the law above – are obvious for people to see. However, to a computer, this implicit structure is typically difficult to unambiguously understand. A computer would not be able to understand (without accuracy issues) the same implicit cues (spacing, headings) that humans easily rely upon to separate out the law into its components and subcomponents.

In general, computers are not as good as people at understanding arbitrary visual cues – like Bold and spacing – that indicate the various parts. A computer might, for instance, not understand where the heading “Inventions Patentable” ends, and the content of the law “Whoever invents” begins. A computer might accidentally read the whole paragraph as one entity, “Inventions Patentable Whoever invents..”

While in principle you can program a computer to make educated guesses about the structure based upon the formatting and spacing, the computer is liable to make errors in “parsing” or reading the law and its structure if there are even minor changes.

In sum, when the law is printed as plain text – as it has traditionally been printed for hundreds of years – very basic computer tasks – such as separating out a Title into its different parts and sub-parts (e.g. Headings, content, chapters,etc), are be comparatively difficult to do with a high level of accuracy.

A simple task that merely involved reading the plain text law and counting the number of Sections in Title 35 – an easy task for a person — would risk errors in a computer.

US Code – Released as XML

In 2013, the U.S. House of Representatives released the titles of the U.S. Code as structured data in xml format. (Previously the Cornell Legal Information Institute had released an unofficial xml version of the federal law as well).

The fact that the law is now marked-up in .xml means that the Section 101 of the Patent Code now looks like this:


<section style="-uslm-lc:I80"
id="id223e3b13-a7cf-11e4-a0e4-817d0c170cd7"
identifier="/us/usc/t35/s101">

<num value="101">§ 101.</num>

<heading> Inventions patentable</heading></p>
<p style="font-size: 11pt;"><content>
<p style="-uslm-lc:I11" class="indent0">

Whoever invents or discovers any new and useful process,
machine, manufacture, or composition of matter,
or any new and useful improvement thereof,
may obtain a patent therefor, subject to the
conditions and requirements of this title.

</p></p>
<p style="font-size: 11pt;"></content>
</section>

Computer Friendly Law

This version of the law is much less human-friendly to read, but much more computer friendly to read.  Computers excel when there are precise, unambiguous rules to follow.

The  .xml version of the U.S. Code makes the structure and hierarchy of the law explicit in a way that a computer can be told read. For instance, rather than guessing about where the text of section 101 begins ands ends based upon bolding and spacing, we have been told explicitly thanks to the <section> tags. The text of Section 101 is everything between the labels

<section> and </section>

The US Government took the time to label the exact start and end of every single section, part, etc of every law in the U.S. Code.

This means that a computer no longer has to approximate based upon visual cues or spacing to determine the start or end of the section. The end result is that a computer can unambiguously and accurately extract the text of any section, subsection, chapter, etc in any US Title.

Extracting the Hierarchy

Additionally, the hierarchy of parts within each US Title has been made explicit. For instance, Title 35 in .xml looks something like this:


<title><num value="35">Title 35—</num>

 <part> <num value="II">PART II—</num>

   <chapter><num value="2">CHAPTER 2—</num>

    <section><num value="101">§ 101.</num>
    </section>

   </chapter>

  </part>

</title>

This structure means that the computer does not have to guess about the hierarchy (e.g. what Part contains what Chapter) in the law based upon visual clues and indenting. Rather, “Title 35” explicitly contains Part I within its tags:
<Title 35>
 <Part I>
 <Part II>
  <Chapter II>
 <Part III>
 <Part IV>
 <Part V>

</Title>

Including Part I inside the Title tags <title></title> indicates that Part II is below  “Title” in the law hierarchy. Similarly, Chapter 2

   <chapter><num value="2">CHAPTER 2—</num>

has been explicitly been placed within Part 2’s opening and closing tags <part> </part>.

  <part> <num value="II">PART II—</num>

This indicates that Part II is contained within Chapter 2, and so on. By explicitly placing one portion within the tags of the other portion, you are explicitly defining the hierarchy in a way that the computer can read.

The upshot is that computers can now precisely read or “parse” the structure (but not the meaning) of the U.S. code. Because of this, we can begin to create interesting visualizations and apps like the U.S. Code explorer that were not previously easy to in the era of “plain-text” law.

In a follow up post, I will explain more about parsing the U.S. Code in .xml and creating visualizations and apps based upon that

Visualizing the US Code -Part 1: Law Explorer

US Code Explorer: Title 35 (Click to Use)

Visualizing the US Code: Law Explorer

I have created a new demonstration application for visualizing and browsing the US Code – the US Code Explorer (beta) (pictured above).  Click on the link or photo to see it in action.

The app is meant as an experiment in visualizing and interacting with the US Code since it has been marked-up in xml by the federal government.

I selected Title 35 (Patent Law) as my example.

There is also a second version with three Titles of the US code: Title 35 (Patents), Title 17 ( Copyright), and Title 20 (Education).  Due to the size, the second version takes a bit longer to load.

Screen Shot 2015-04-01 at 9.22.04 PM

Version with Multiple Titles: Title 35, Title 17, Title 20

The look and presentation of the visualization parallels the visual style that that I use when I present the law to my students when I teach Patent Law and Introduction to Intellectual Property.  During class, the visualizations are static Powerpoint slides.  This is a more interactive version.

Please note – this is merely a beta version of this visualization.  Neither the computer code, nor the US code, have been thoroughly tested.  Please do not rely on this app for the law as there may be errors or omissions.

I will have a follow up post explaining in more depth what I did, but in short, I wrote a parser in python to read through the US Code xml files and extract the law hierarchy from the titles.  I then exported the structure in .json format.

And finally, I used the amazing d3 data visualization framework to create the visualization.  Here, I borrowed heavily and employed a modified version of Mike Bostock’s d3 collapseable hierarchical tree.

This is the first is a series of data visualization experiments of the US Code that I will employ using the d3 framework.  The projects will be found in here.

Probability Tree Diagrams in R

As part of a Problem Solving Course that I teach, I have several sessions on probability theory. Given that attorneys must frequently make decisions in environments of uncertainty, probability can be a useful skill for law students to learn.

Conditional probability, and Bayes’ Theorem, are important sub-topics that I focus upon.  In teaching my students about Conditional Probability, it is often helpful to create a Conditional Probability Tree diagram like the one pictured below (sometimes called a probability tree).  I’ll explain in a future post why such a diagram/graph is a useful visualization for learners.

(See also this Javascript Conditional Probability Tree Diagram webpage that I created in that I describe in a different post.)

Conditional Probability Tree Diagram

Conditioal Probability Tree 3

No Probability Tree Diagrams in R ?

Like many others, I use the popular free, and open-source R statistical programming language.  R is one of the top computing platforms in which to perform machine learning and other statistical tasks (along with Python – another favorite of mine).  To program in R, I use the excellent R-Studio application which makes the experience much better.

Given the relationship between R and statistics, I was somewhat surprised that I was unable to find any easily accessible R code or functions to create visually appealing Conditional Probability Tree diagrams like the one above.

Thus, I put together some basic R code below for visualizing conditional probability trees, using the Rgraphviz R package.  You must install the Rgraphviz package before using the R code below. If you know of other ways to create visually appealing conditional probability tree in R that I may have missed in my search, please let me know.

I thought I’d release the code below to others in case it is useful.

(Caveat:  This is rough code, and has not been thoroughly tested, and is just meant as a starting example to help make your own probability tree diagrams – so no guarantees).

(You can also look at this other post about creating a Probability Tree Diagram Using Javascript and D3 if R is not your preferred platform.)

R Code to Create a Visual Conditional Probability Tree


# R Conditional Probability Tree Diagram

# The Rgraphviz graphing package must be installed to do this
require("Rgraphviz")

# Change the three variables below to match your actual values
# These are the values that you can change for your own probability tree
# From these three values, other probabilities (e.g. prob(b)) will be calculated 

# Probability of a
a<-.01

# Probability (b | a)
bGivena<-.99

# Probability (b | ¬a)
bGivenNota<-.10

###################### Everything below here will be calculated

# Calculate the rest of the values based upon the 3 variables above
notbGivena<-1-bGivena
notA<-1-a
notbGivenNota<-1-bGivenNota

#Joint Probabilities of a and B, a and notb, nota and b, nota and notb
aANDb<-a*bGivena
aANDnotb<-a*notbGivena
notaANDb <- notA*bGivenNota
notaANDnotb <- notA*notbGivenNota

# Probability of B
b<- aANDb + notaANDb
notB <- 1-b

# Bayes theorum - probabiliyt of A | B
# (a | b) = Prob (a AND b) / prob (b)
aGivenb <- aANDb / b

# These are the labels of the nodes on the graph
# To signify "Not A" - we use A' or A prime 

node1<-"P"
node2<-"A"
node3<-"A'"
node4<-"A&B"
node5<-"A&B'"
node6<-"A'&B"
node7<-"A'&B'"
nodeNames<-c(node1,node2,node3,node4, node5,node6, node7)

rEG <- new("graphNEL", nodes=nodeNames, edgemode="directed")
#Erase any existing plots
dev.off()

# Draw the "lines" or "branches" of the probability Tree
rEG <- addEdge(nodeNames[1], nodeNames[2], rEG, 1)
rEG <- addEdge(nodeNames[1], nodeNames[3], rEG, 1)
rEG <- addEdge(nodeNames[2], nodeNames[4], rEG, 1)
rEG <- addEdge(nodeNames[2], nodeNames[5], rEG, 1)
rEG <- addEdge(nodeNames[3], nodeNames[6], rEG, 1)
rEG <- addEdge(nodeNames[3], nodeNames[7], rEG, 10)

eAttrs <- list()

q<-edgeNames(rEG)

# Add the probability values to the the branch lines

eAttrs$label <- c(toString(a),toString(notA),
 toString(bGivena), toString(notbGivena),
 toString(bGivenNota), toString(notbGivenNota))
names(eAttrs$label) <- c(q[1],q[2], q[3], q[4], q[5], q[6])
edgeAttrs<-eAttrs

# Set the color, etc, of the tree
attributes<-list(node=list(label="foo", fillcolor="lightgreen", fontsize="15"),
 edge=list(color="red"),graph=list(rankdir="LR"))

#Plot the probability tree using Rgraphvis
plot(rEG, edgeAttrs=eAttrs, attrs=attributes)
nodes(rEG)
edges(rEG)

#Add the probability values to the leaves of A&B, A&B', A'&B, A'&B'
text(500,420,aANDb, cex=.8)

text(500,280,aANDnotb,cex=.8)

text(500,160,notaANDb,cex=.8)

text(500,30,notaANDnotb,cex=.8)

text(340,440,"(B | A)",cex=.8)

text(340,230,"(B | A')",cex=.8)

#Write a table in the lower left of the probablites of A and B
text(80,50,paste("P(A):",a),cex=.9, col="darkgreen")
text(80,20,paste("P(A'):",notA),cex=.9, col="darkgreen")

text(160,50,paste("P(B):",round(b,digits=2)),cex=.9)
text(160,20,paste("P(B'):",round(notB, 2)),cex=.9)

text(80,420,paste("P(A|B): ",round(aGivenb,digits=2)),cex=.9,col="blue")

Another Probability Tree Example in Light Blue with (¬ sign)


Rplot02

Predicting Supreme Court Decisions Using Artificial Intelligence

Predicting Supreme Court Outcomes Using AI ?

Is it possible to predict the outcomes of legal cases – such as Supreme Court decisions – using Artificial Intelligence (AI)?  I recently had the opportunity to consider this point at a talk that I gave entitled “Machine Learning Within Law” at Stanford.

At that talk, I discussed a very interesting new paper entitled “Predicting the Behavior of the Supreme Court of the United States” by Prof. Dan Katz (Mich. State Law),  Data Scientist Michael Bommarito,  and Prof. Josh Blackman (South Texas Law).

Katz, Bommarito, and Blackman used machine-learning AI techniques to build a computer model capable of predicting the outcomes of arbitrary Supreme Court cases with an accuracy of about 70% – a strong result.  This post will discuss their approach and why it was an improvement over prior research in this area.

Quantitative Legal Prediction

The general idea behind such approaches is to use computer-based analysis of existing data (e.g. data on past Supreme Court cases) in order to predict the outcome of future legal events (e.g. pending cases).  The approach to using data to inform legal predictions (as opposed to pure lawyerly analysis) has been largely championed by Prof. Katz – something that he has dubbed  “Quantitative Legal Prediction” in recent work.

Legal prediction is an important function that attorneys perform for clients.  Attorneys predict all sorts of things, ranging from the likely outcome of pending cases, risk of liability, and estimates about damages, to the importance of various laws and facts to legal decision-makers.   Attorneys use a mix of legal training, problem-solving, analysis, experience, analogical reasoning, common sense, intuition and other higher order cognitive skills to engage in sophisticated, informed assessments of likely outcomes.

By contrast, the quantitative approach takes a different tack:  using analysis of data employing advanced algorithms to result in data-driven predictions of legal outcomes (instead of, or in addition to traditional legal analysis).  These data-driven predictions can provide additional information to support attorney analysis.

Predictive Analytics: Finding Useful Patterns in Data

Outside of law, predictive analytics has widely applied to produce automated, predictions in multiple contexts.   Real world examples of predictive analytics include: the automated product recommendations made by Amazon.com, movie recommendations made by Netflix, and the search terms automatically suggested by Google.

Scanning Data for Patterns that Are Predictive of Future Outcomes

In general, predictive analytics approaches use advanced computer algorithms to scan large amounts of data to detect patterns.  These patterns can be often used to make intelligent, useful predictions about never-before-seen future data.  Many of these approaches employ “Machine Learning” techniques to engage in prediction. I have written about some of the ways that machine-learning based analytical approaches are starting to be used within law and the legal system.

Broadly speaking, machine-learning refers to a research area studying computer systems that are able improve their performance on some task over time with experience.  Such algorithms are specifically designed to detect patterns in data that can be highlight non-obvious relationships or that can be predictive of future outcomes (such as detecting Netflix users who like movie X, tend also to like movie Y and concluding you like movie X, so you’re likely to like movie Y.)

Importantly these algorithms are designed to “learn” –  in the sense that they can change their own behavior to get better at some task – like predicting movie preferences – over time by detecting new, useful patterns within additional data.  Thus, the general idea behind predictive legal analytics is to examine data concerning past legal cases and use  machine learning algorithms to detect and learn patterns that could be predictive of future case outcomes.

In such a machine learning approach — called supervised learning –  we “train” the algorithm by providing it  with examples of past data that is has been definitively classified.  For example, there may be a body of existing data about Supreme Court cases along with confirmed data indicating whether the outcome was affirm or reverse, along with other potentially predictive data, such as lower circuit, and subject matter at issue.  Such an algorithm examines this training data to detect patterns and statistical correlations between variables and outcomes (e.g. 9th Circuit cases more likely to be reversed) and build a computer model that will be predictive of future outcomes.

It is helpful to briefly review some earlier research in using data analytics to engage prediction of Supreme Court outcomes to understand the contribution of Katz, Bommarito, and Blackman’s paper.

Prior Work in Analytical Supreme Court Prediction

Pioneering work in the area of quantitative legal prediction began in 2004 with a seminal project by Prof. Ted Ruger (U Penn), Andrew D. Martin (now dean at U Michigan) and other collaborators, employing statistical methods to predict Supreme Court outcomes.   That project pitted experts in legal prediction – law professors and attorneys – against a statistical model that had analyzed data about hundreds of past Supreme Court cases.

Somewhat surprisingly the computer model significantly outperformed the experts in predictive ability. The computer model correctly forecasted 75% of Supreme Court outcomes, while the experts only had a 59% success rate in predicting Supreme Court affirm or reversal decisions.  (The computer and the experts performed roughly the same in predicting the votes of individual justices – as opposed to the ultimate outcome –  with the computer getting 66.7 % correct predictions vs. the experts 67.9%).

Improvements by Katz, Bommarito, and Blackman (2014)

The work by Ruger, Martin et. al – while pioneering – left some room for improvement.  One aspect was that their predictive model – while highly predictive of the relatively short time frame examined (the October 2002 term)  – was thought not to be broadly generalizable to predicting arbitrary Supreme Court cases across any timespan.  A primary reason was that the period of Supreme Court cases that they examined to build their models – roughly 1994 – 2000 – involved an unusually stable court.  Notably, this period exhibited no change in personnel (i.e. justices leaving the court and new justices being appointed).

A model that was “trained” on data from an unusually stable period of the Supreme Court, and tested on a short case-load of relatively non-fluctuation might not perform as accurately when applied to a broader or less homogenous examination period, or might not handle changes in court composition in a robust manner.

Ideally, we would any such computer predictive model to be flexible enough, and generalizable enough to handle significant changes in personnel and still be able to produce accurate predictions. Additionally, such a model should be general enough to predict case outcomes with a relatively consistent level of accuracy regardless of the term or period of years examined.

Katz, Bommarito, and Blackman: Machine Learning And Random Forests

While building upon Ruger et al’s pioneering work. Katz, Bommarito, and Blackman improve upon it by employing a relatively new machine learning approach known as “Random Forests.”   Without getting into the details, it is important to note that Random Forest approaches have been shown to be quite robust and generalizable as compared to other modeling approaches in contexts such as this.   The authors applied this algorithmic approach to examine data about past Supreme Court cases found in the Supreme Court Database.  In addition to outcome (e.g. affirmed, reverse), this database contains hundreds of variables about nearly every Supreme Court decision of the past 60 years.

Recall that machine learning approaches often working by providing an algorithm with existing data (such as data concerning past Supreme Court case outcomes and potentially predictive variables such as lower-circuit) in order to “train” it.  The algorithms looks for patterns and builds an internal computer model that can hopefully be used to provide prediction is future, never-before-seen data – such as pending Supreme Court case.

Katz, Bommarito, and Blackman did this and produced a new robust machine-learning based computer model that correctly forecasted ~ 70%  of Supreme Court affirm / reverse decisions.

This was actually a significant improvement over prior work.   Although Ruger’s et. al’s model had a a 75% prediction rate on the period it was analyzed against,  Katz et. al’s model was a much more robust, generalizable model.

The new model is able to withstand changes in Supreme Court composition and still produce accurate results even when applied across widely variable supreme court terms, with varying levels of case predictability.   In other words, it is unlikely that the Ruger model – focused only on one term 2002 – would produce a 75% rate across a 50 year range of Supreme Court jurisprudence.  By contrast, the computer model produced by Katz et. model consistently delivered a 70% prediction rate across nearly 8,000 cases across 50+ years.

Conclusion: Prediction in Law Going Forward

Katz, Bommarito, and Blackman’s paper is an important contribution.  In the not too distant future, such data-driven approaches to engaging in legal prediction are likely to become more common within law. Outside of law, data analytics and machine-learning have been transforming industries ranging from medicine to finance, and it is unlikely that law will remain as comparatively untouched by such sweeping changes as it remains today.

In future posts I will discuss machine learning within law more generally, and principles for understanding what such AI techniques ca, and cannot do within law given the state of current technology, and some implications of these technological changes.