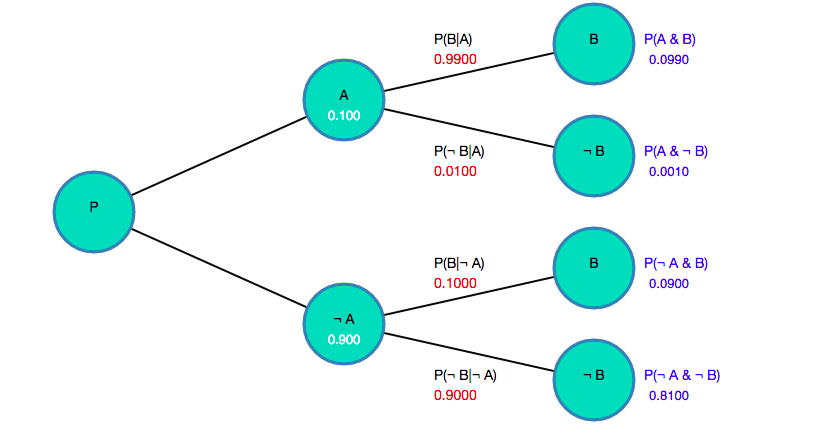
Probability Tree Diagram
Click on Tree Image to Use Interactive App
This post will discuss an Interactive Conditional Probability Tree Diagram that I created and how and why to do it.
Conditional Probability and Probability Trees
I include some basic probability theory as part of a Problem Solving Course that I teach to law students. Probability can be a useful skill for law students to learn given that attorneys are often called upon to make decisions in environments of uncertainty.
In teaching my students about Conditional Probability, it is often helpful to create a Conditional Probability Tree diagram like the one pictured above. Probability Tree diagrams can help the students visualize the branching structure of conditional probability.
Probability Tree Diagrams Using D3 and Javascript
To create the interactive conditional probability tree diagram, I used the excellent D3 Data Framework and Javascript.
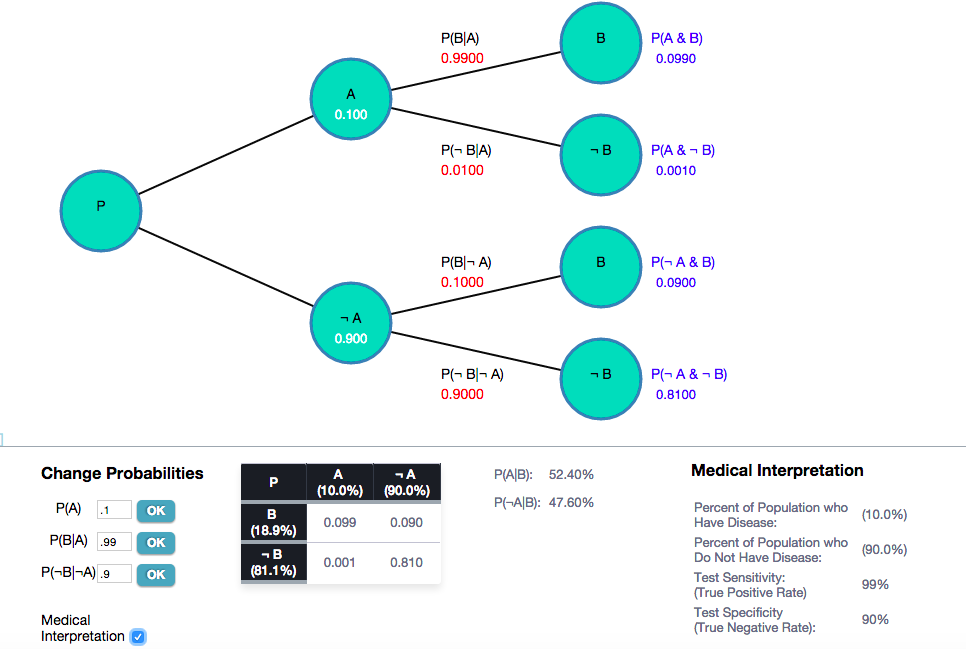
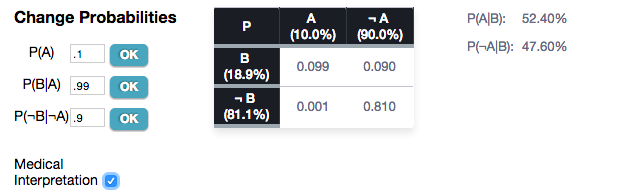
The diagram automatically computes the relevant conditional probabilities given the input data. It also allows you to change the input probabilities and recompute.
(You can also see an earlier conditional probability tree diagram that I created using the R programming language).
Conditional Probability and Medical Testing
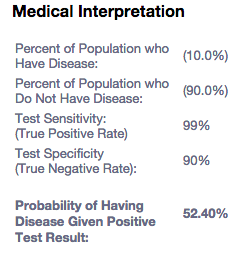
The structure of the tree was inspired by the way Bayes’ Theorem is used in testing for diseases in medicine. When there is a disease with a low prevalence in the population (say, fewer than 1/100 people have the disease), a positive result on a medical test for the disease sometimes produce surprising, counter-intuitive probabilities as to whether the patient actually has the disease even with a positive result on a highly accurate test.
There is a parallel issue in law involving rare evidence and Bayes’ Theorem. Students often find this concept difficult to learn, and the probability tree can aid in comprehension. I will explain this phenomenon further in a future post.
You can click on the “Medical Interpretation” to see a interpretation of the tree along the medical paradigm described.
Code for Basic Probability Tree
Below is the code for a more basic basic probability tree diagram that reads in the data structure and displays a tree. Such a basic diagram is much shorter and lacks much of the functionality of the interactive probability tree. I included the basic source code (rather than the full source code of the demo) below because it is much simpler to understand than the code for the interactive one. This should give the gist of how to create a probability tree diagram using d3 and javascript.
<!DOCTYPE html>
<meta charset="utf-8" xmlns="http://www.w3.org/1999/html">
<html>
<head>
    <!--// Load up d3 scripts and other scripts-->

    <script type="text/javascript" src="https://cdnjs.cloudflare.com/ajax/libs/d3/3.5.5/d3.js"></script>

<style>

    .td2{
        text-align:left;
        padding-top:2px;
        color: #666B85;
    }

    .svgHolder{
        position:absolute;
        left:10px;
        top:0px;
    }

    circle {
        fill: #0fd4b9;
        stroke: steelblue;
        /*stroke:grey;*/
        stroke-width: 3px;
        /*opacity: .8;*/
    }

    text { font: 14px sans-serif; }

    .subText {
        font: 13px sans-serif;
        fill:blue;
    }

    .subTextWhite{
        font: 13px sans-serif;
        fill:white;
    }

    .link {
        fill: none;
        /*stroke: #ccc;*/
        stroke:#0B0B0B;
        stroke-width: 2px;
    }

    .givenProb{
        font-family: 'Open Sans','Helvetica Neue', 'Helvetica', Arial, Verdana;
        font-size:14px;
        text-align: center;
        fill:red;
    }

    .label1{
        font-family: 'Open Sans','Helvetica Neue', 'Helvetica', Arial, Verdana;
        font-size:14px;
        width:55px;
        text-align: center;
        fill:blue;
    }

</style>

</head>

<body>

<div class="mainContainer">
    <div class="svgHolder">

    </div>

    <div class="tablex">
        <table >

            <tbody>
            <tr style="height:10px;">
                <td class="td2"> P(A|B): </td>
                <td> </td>
                <td class="td2" style="height:10px"> <span id="tableAGivenB"></span></td>
            </tr>
            <tr>
                <td class="td2" style=""> P(¬A|B): </td>
                <td> </td>
                <td class="td2" style="height:10px"> <span id="tableNotAGivenB"></span></td>
            </tr>
            </tbody>
        </table>

    </div>
</div>
<script>

    var data = [
        {
            "name": "P",
            "num":"0",
            "display": "P",
            "parent": "null",
            "children": [
                {
                    "name": "A",
                    "num":"1",
                    "display": "A",
                    "probability":".01",
                    "children": [
                        {
                            "name": "A&B",
                            "num":"3",
                            "display": "B",
                            "givenName":"P(B|A)",
                            "given":".99"
                        },
                        {
                            "name": "A&¬B",
                            "num":"4",
                            "display": "¬ B",
                            "givenName":"P(¬ B|A)"
                        }
                    ]
                },
                {
                    "name": "¬ A",
                    "display": "¬ A",
                    "num":"2",
                    "children": [
                        {
                            "name": "¬A&B",
                            "display": "B",
                            "num":"5",
                            "givenName":"P(B|¬ A)"
                        },
                        {
                            "name": "¬A&¬B",
                            "display": "¬ B",
                            "num":"6",
                            "given":".9",
                            "givenName":"P(¬ B|¬ A)"
                        }

                    ]
                }

            ]
        }
    ];

    var grandChildSpacing = 0;

    var margin = {top: 00, right: 140, bottom: 0, left: 90},
            width = 800 - margin.right - margin.left,
            height = 700 - margin.top - margin.bottom + (grandChildSpacing*4);

    var i = 0;
    var radius=40;

    var tree = d3.layout.tree()
            .nodeSize([80,100])
            .separation(function (a,b) {
                if (a.depth ==2){
                    return 1.4
                } else {
                    return 1
                }
            });

    var svg = d3.select(".svgHolder").append("svg")
            .attr("width", width + margin.right + margin.left)
            .attr("height", height + margin.top + margin.bottom)
            .append("g")
            .attr("id","topg")
            .attr("class","topg")
            .attr("transform", "translate(100,220)");

    root = data[0];

    // Assign variables to different parts of data structure

    var a = root.children[0];
    var notA = root.children[1];

    var aANDb = a.children[0];
    var aANDnotB = a.children[1];

    var notAANDb = notA.children[0];
    var notAANDnotB = notA.children[1];

    var b, notB, aGivenB, notAGivenB=0;

    updateProbabilities();

    update (root);
    updateTable ();

    function updateProbabilities (){
        // Use conditional probability to compute the vaarious values

        // Not A is always 1 minus A
        notA.probability =  (1-a.probability).toFixed(3);

        aANDnotB.given = (1-aANDb.given).toFixed(4);
        aANDb.probability = (a.probability* aANDb.given).toFixed(4);

        aANDnotB.probability = (a.probability*aANDnotB.given).toFixed(4);

        notAANDb.given= (1-notAANDnotB.given).toFixed(4);

        notAANDb.probability = (notA.probability * notAANDb.given).toFixed(4);
        notAANDnotB.probability = (notA.probability*notAANDnotB.given).toFixed(4);

        b = (Number(aANDb.probability) + Number(notAANDb.probability)).toFixed(3);
        notB =(Number(aANDnotB.probability) + Number(notAANDnotB.probability)).toFixed(3);;

        // Bayes' Theorem
        aGivenB = (Number(aANDb.probability)/b).toFixed(3);
        notAGivenB = (1-aGivenB).toFixed(3);
    }

    function update(source) {

        // Pass in the data structure "data"
        // d3 creates a visual tree layout using that data
        // Links are the source and target locations for the lines between the circles

        var nodes = tree.nodes(root).reverse(),
                links = tree.links(nodes);

//      This tree will be evenly spaced fixed depth
        // with each level 250px from the previous
        // To compress or enlarge the tree, change this number

        nodes.forEach(function (d) {
            d.y = d.depth * 250;
        });

        // Create the invdidual Nodes on the on the tree
        // and bind/join them to you data structure
        // Each element in your data structure "data" is assigned to a
        // Node
        var node = svg.selectAll("g.node")
                .data(nodes, function (d) {
                    if (d.id){
                        return d.id;
                    } else {
                        d.id= i++;
                        return d.id;
                    }
//                    return d.id || (d.id = ++i);
                });

        var grandChildCount=0;

//        // Declare and append the links (the lines between nodes)
        // Links go first so they are in front of circles in display

        var topg = d3.select("#topg");

        var link = topg.selectAll(".link")
                .data(links, function(d) {
                    return d.target.id;
                });

        var linkEnter = link.enter().insert("line")
                .attr("class", "link")
                .attr("x1", function (d){
                    return d.source.y;
                })
                .attr("y1", function (d){
                    return d.source.x;
                })
                .attr("x2", function (d){
                    return d.target.y;
                })
                .attr("y2", function (d){
                    return d.target.x;
                });

        // Enter the nodes.
        var nodeEnter = node.
                enter().append("g")
                .attr("class", "node")
                .attr("transform", function (d) {
                    // This is to make the vertical spacing more pleasant
                    // for the last column of no
                    var y = d.y;
                    var x = d.x ;
                    d.shiftX=x;
                    if (d.depth==2){
                        if (grandChildCount%2) {
                            x = x-grandChildSpacing;
                            d.shiftX = x;
                        } else
                        {
                            x=x+grandChildSpacing;
                            d.shiftX = x;
                        }
                        grandChildCount++;
                    }
                    d.dy = y;
                    d.dx=x;
                    return "translate(" +  y+ "," + x + ")";
                });

        // Add a circle around the node
        nodeEnter.append("circle")
                .attr("r", radius);

        // Add the name of the node
        nodeEnter.append("text")
                .text(function (d) {
                    return d.display;
                })
                .attr("text-anchor","middle")
                .style("fill-opacity", 1);

        // Add the probability of the node below that
        nodeEnter.append("text")
                .text(function (d) {
                    if (d.probability) {
                        return d.probability

                    } else { return ""}
                })
                .attr("y","20")
                .attr("text-anchor","middle")
                .attr("class","subText")
                .attr("class", function (d){
                    if (d.depth==2){
                        return "subText"
                    } else{return "subTextWhite"}
                })
                .attr("x", function (d){

                    // For the last column, shift the values to the right
                    // of the circle rather than inside it
                    if (d.depth==2){
                        return 75;
                    }  else {return 0}

                });

        nodeEnter.append("text")
                .text(function (d) {
                    var text="";
                    if (d.depth ==2) {
                        var set1 = d.parent.display;
                        var set2 = d.display;
                        text = "P(" +set1 + " & "+ set2 +")";
                    }
                    return text;
                })
                .attr("class", "label1")
                .attr("transform","translate(50)")
        ;

        // Label the links with the "Given" values
        // For example: B|A (B given A)
        var gGiven = nodeEnter.filter(function (d){
            if (d.depth!=0){
                return true;
            } else {
                return false;
            }
        })
                .append("g")

                .attr("transform","translate(-160)")

        gGiven.append("text")
                .attr("class","given")
                .text(function (d) {
                    if (d.givenName){
                        return d.givenName
                    } else {
                        return "";
                    }
                });

        // Label the Links;

        gGiven.append("text")
                .attr("class","givenProb")
                .text(function (d){
                    if (d.given){
                        return d.given;
                    }else{
                        return "";
                    }
                })
                .attr("y","20");

    }

    function updateTable (){

        d3.selectAll("#tableAGivenB,#probDiseaseGivenPositive").text(String((aGivenB*100).toFixed(2)).replace(/^0+/, '')+"%");
        d3.select("#tableNotAGivenB").text(String((notAGivenB*100).toFixed(2)).replace(/^0+/, '')+"%");

    }

</script>