Category Archives: Data Visualization

The U.S. Constitution in XML

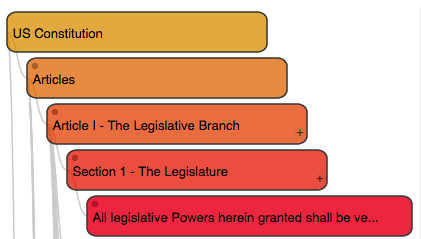
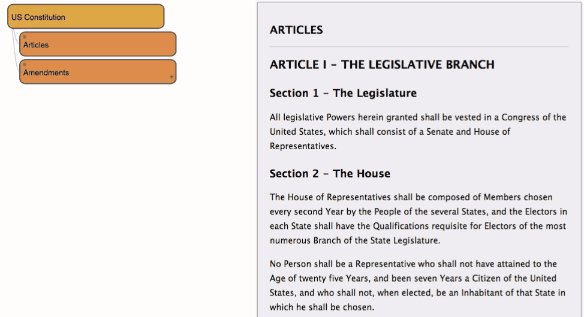
One of the more challenging aspects in creating the interactive app for exploring the United States Constitution was the lack of an XML version of the U.S. Constitution.

US Constitution Explorer

conaminationOnce

Click on the image above to launch the app


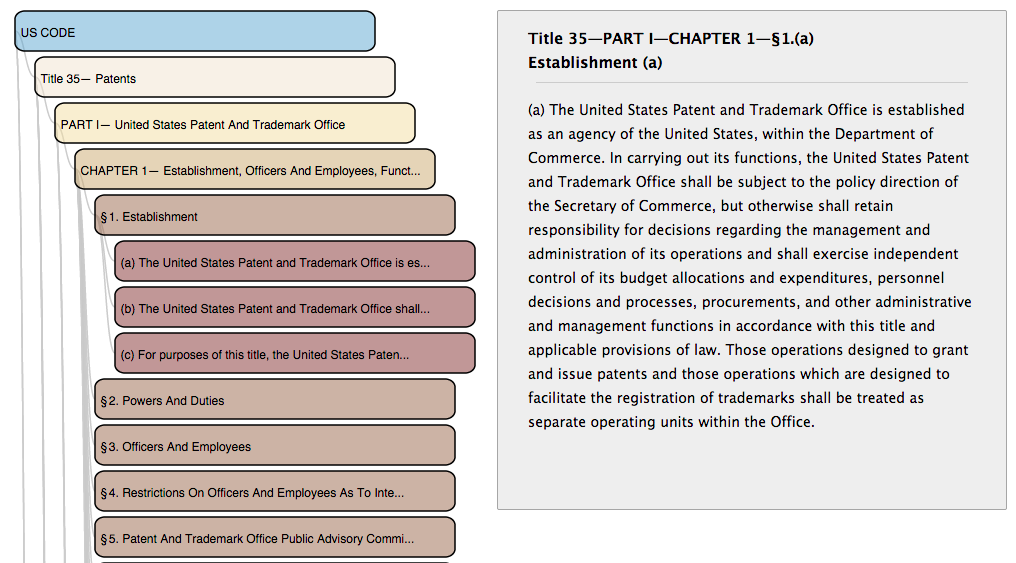
I looked around on the web a bit, but I was unable to find one.  (Perhaps I missed it, please let me know).  This in contrast to the Titles of the U.S. Code which have been released in .xml Format.

(Edit: Update – Some time after I wrote this, Congress released an Official version of the US Constitution in xml – located here.  You may prefer that to my unofficial version below.)

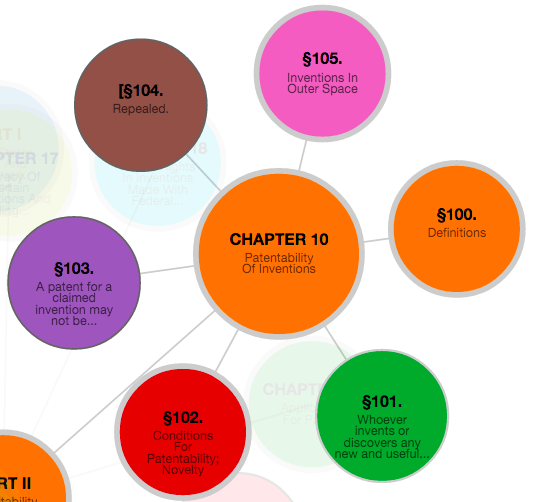
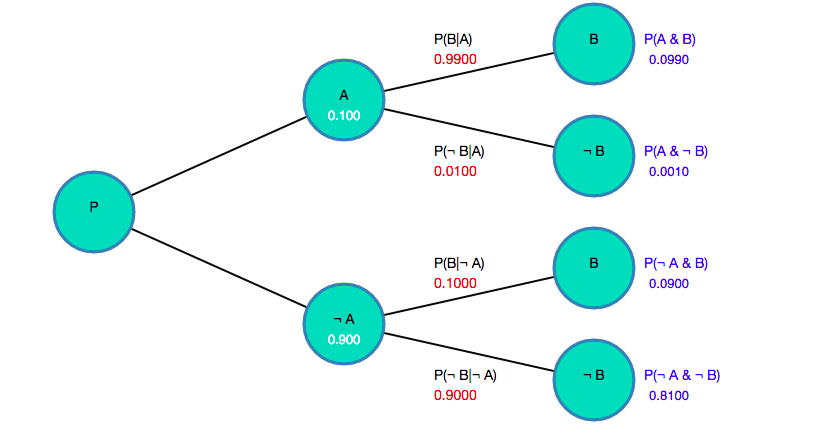
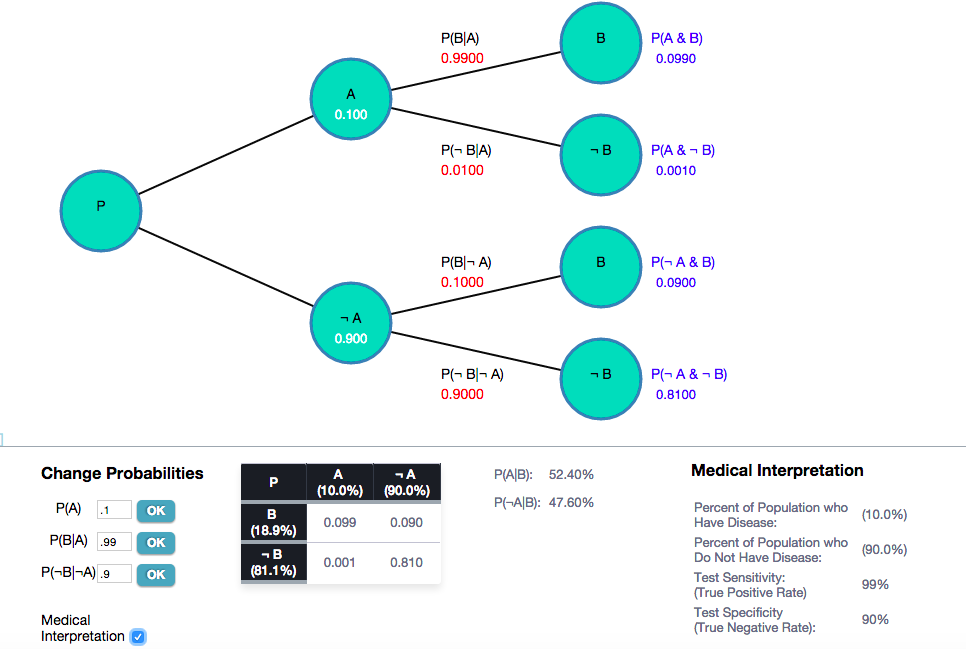
Structuring the law as data in XML (or some other structured format) is what permits us to create interesting visualizations like the above, or those here and here.

US Constitution in XML

Constitution in XML

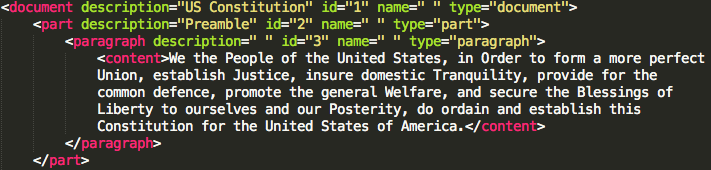
Thus, I decided to create versions of the U.S. Constitution in XML and JSON (Javascript Object Notation) format.  The text of the Constitution was copied from this source.  I wrote a parser in python to read in the plain text file and create the xml and JSON files based upon the heading structure.

You can download this version of the U.S. Constitution in XML from github or simply copy from below.  Please note, this is just a “beta” version.  I haven’t fully vetted the contents of the Constitution that I copied, and while I believe it to be correct, there may be errors.  Please feel free to copy it and adapt it for your own purposes.
Continue reading

Exploring the Constitution Visually

I have developed a new experimental interactive app for exploring the United States Constitution.

US Constitution Explorer

conaminationOnce

Click on the image above to launch the app

This app allows you to navigate the contents of the U.S. Constitution while displaying the overall hierarchy and structure. You can click on the various Articles and Amendments to expand the sub-parts and and see the accompanying text.

Consitution List2

This app was somewhat more challenging to develop because I was unable to find any version of the U.S. Constitution that had been written in .xml.  Thus, I had to create an .xml version of the Constitution myself.  In a follow-up post, I will include the xml version of the U.S. Constitution

This app was created using the d3 data visualization framework and javascript.  It uses Mike Bostock’s collapsible tree framework as a base.

Interactive Visualizations of U.S. Law

circleExploded

Recently I created two different interactive apps visualizing and exploring the Titles of the U.S. Code.  You can browse the text of Title 35 (Patent) and Title 17 (Copyright) in a visually interesting manner. Click on the photos below to use them.

Tree Layout Visualization

US Code Explorer Screen shot

Force Directed Graph Visualization

Copyright Circles

D3, Javascript, .xml

These layouts were created using the d3 data visualization framework, javascript, and xml.  They take advantage of the fact that the Titles of the U.S. Code have been released in .xml.

More explanations can be found in blog posts here and here.

Visualizing US Law – Force Directed Graph

circleExploded

I have created a new experimental app for visualizing and exploring U.S. Law using a force-directed graph.  You can click on the picture above to launch it. This force-directed visualization is more intended to be visually interesting rather than a full-fledged U.S. law navigation tool.

This is the second in a series of data visualizations of US Federal Law that I am creating using the d3 data visualization framework and javascript.  The first data visualization is located here.

Explore the Copyright Code or the Patent Code

This app allows you to explore two titles of the US Code.

Title 17 – The Copyright Code

Copyright Circles

Title 35 – The Patent Code

Patent Circles

Hub and Spoke Representation of US Code Hierarchy

The chart uses a “hub and spoke” layout to represent the hierarchy of a given Title of the U.S. Code such as Title 35.  The center circle represents a “parent” portion of the code – a portion with sub-portions under it (e.g. Chapter 10) and the surrounding circles on the edge represent the “children” portions that belong to that parent (Section 100, Section 101, section 103..).

Screen Shot 2015-04-28 at 5.03.31 PM

You can click on an outer circle to open up the “children” parts that reside under that circle.  If a circle has “children” parts, the circle border will be a thick grey.  The selected circle will then be the new “parent”, and its “children” portions will be displayed.

Force Directed Graph

The app uses a “force directed graph” engine to display the titles of the U.S. Code.  Force directed graphs are often used to model interactions between physical objects, such as molecules reacting to gravity.  Because force directed graphs such as this simulate physical forces such as gravity, using this framework to display data means that various parts can tend to move around somewhat randomly.
Continue reading

Probability Tree Diagrams Using D3 and Javascript

Probability Tree Diagram

Screen Shot 2015-04-21 at 11.02.20 AM

Click on Tree Image to Use Interactive App

This post will discuss an Interactive Conditional Probability Tree Diagram that I created and how and why to do it.

Conditional Probability and Probability Trees

I include some basic probability theory as part of a Problem Solving Course that I teach to law students.  Probability can be a useful skill for law students to learn given that attorneys are often called upon to make decisions in environments of uncertainty.

In teaching my students about Conditional Probability, it is often helpful to create a Conditional Probability Tree diagram like the one pictured above. Probability Tree diagrams can help the students visualize the branching structure of conditional probability.

Probability Tree Diagrams Using D3 and Javascript

To create the interactive conditional probability tree diagram, I used the excellent D3 Data Framework and Javascript.


Screen Shot 2015-04-21 at 11.02.40 AM


The diagram automatically computes the relevant conditional probabilities given the input data.  It also allows you to change the input probabilities and recompute.
Continue reading