
I have created a new experimental app for visualizing and exploring U.S. Law using a force-directed graph. You can click on the picture above to launch it. This force-directed visualization is more intended to be visually interesting rather than a full-fledged U.S. law navigation tool.
This is the second in a series of data visualizations of US Federal Law that I am creating using the d3 data visualization framework and javascript. The first data visualization is located here.
Explore the Copyright Code or the Patent Code
This app allows you to explore two titles of the US Code.
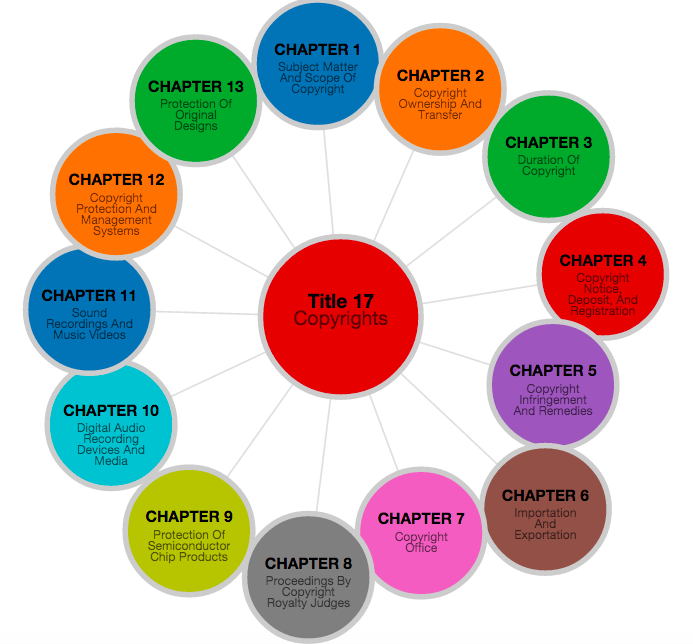
Title 17 – The Copyright Code
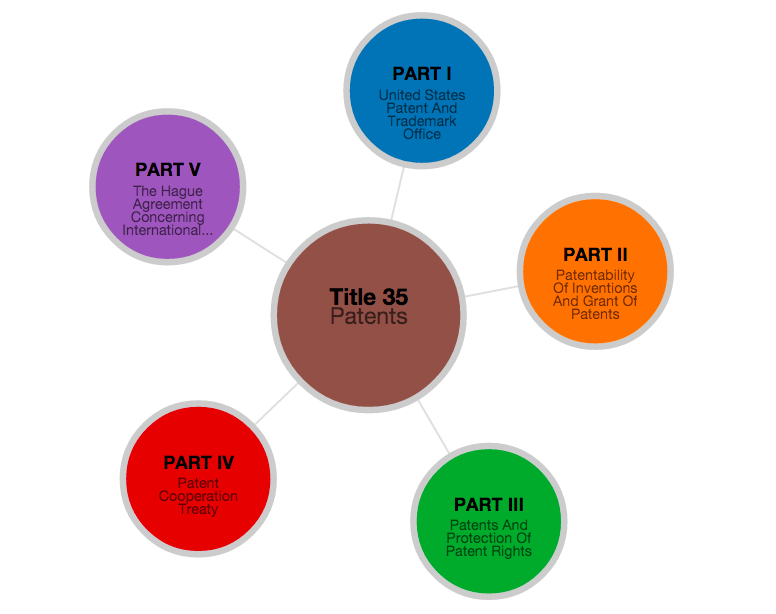
Title 35 – The Patent Code
Hub and Spoke Representation of US Code Hierarchy
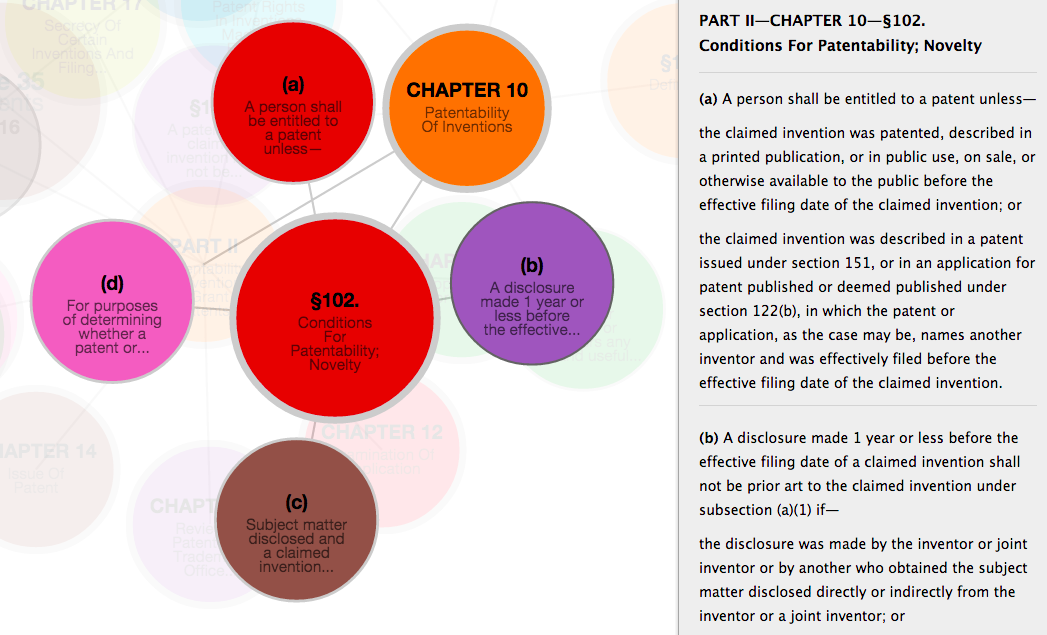
The chart uses a “hub and spoke” layout to represent the hierarchy of a given Title of the U.S. Code such as Title 35. The center circle represents a “parent” portion of the code – a portion with sub-portions under it (e.g. Chapter 10) and the surrounding circles on the edge represent the “children” portions that belong to that parent (Section 100, Section 101, section 103..).
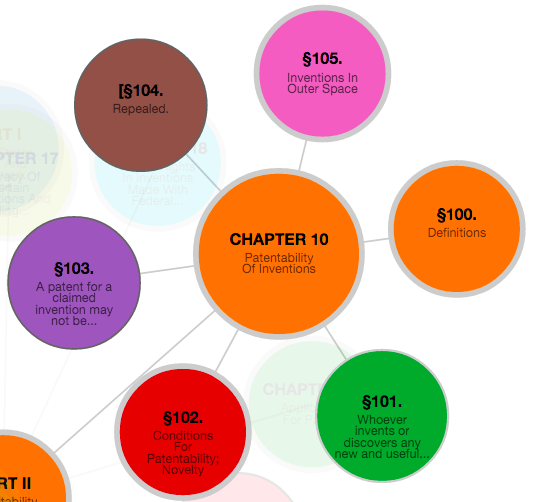
You can click on an outer circle to open up the “children” parts that reside under that circle. If a circle has “children” parts, the circle border will be a thick grey. The selected circle will then be the new “parent”, and its “children” portions will be displayed.
Force Directed Graph
The app uses a “force directed graph” engine to display the titles of the U.S. Code. Force directed graphs are often used to model interactions between physical objects, such as molecules reacting to gravity. Because force directed graphs such as this simulate physical forces such as gravity, using this framework to display data means that various parts can tend to move around somewhat randomly.
Thus, you may notice that the layout of the different sections and subsections are not necessarily always in numerical order, or that the first section in a group of sections is located in the bottom of the circle, rather than at the top. This is is simply an unavoidable byproduct of using a force directed graph – the various portions sometimes drift around in unexpected places due to the force simulation. Thus, the layout is not entirely stable, but that’s the tradeoff of using a force-directed layout.
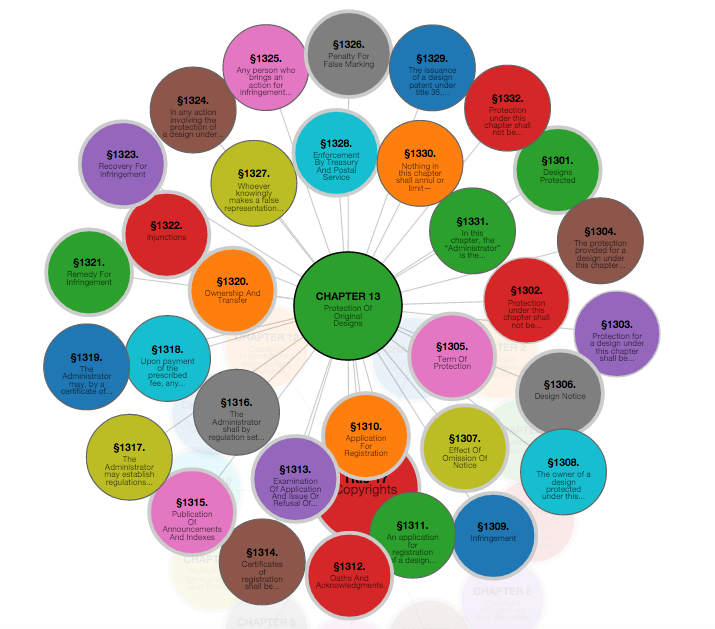
Also, when there is a section with multiple sub-parts (as in Chapter 13 of the Copyright code below), the force directed layout can get a little crowded.
For this reason, the force-directed graph may not be quite as useful for actually navigating the U.S. code as the Tree Layout visualization that I created previously. Rather, it is more intended as a aesthetically pleasing visualization of the U.S. code more than as a utilitarian law browser.
If you click on a circle that represents a “Part” or a “Chapter” of the title, the sub-parts expand, and the text of the law that is associated with that section appears in the grey bar on the side.
You can use the grey arrows in the upper right left hand corner to navigate back to through the hierarchy. The up arrow brings you to the top of the hierarchy (e.g. Title 17), and the left arrow brings you up one level, to the “parent” of the currently open circle. You can also click on an open circle to bring it back to it’s parent.
D3, Javascript, and XML
This was created using the excellent d3 data visualization framework and javascript. I used Mike Bostock’s d3 force-directed layout.
Visualizations like this are now possible ever since the U.S. House of representatives released the U.S. federal law in structured .xml format. To read more about how the U.S. law became structured, you can read this blog post here.
I will have a follow up post explaining in more depth what I did, but in short, I wrote a parser in python to read through the US Code xml files and extract the law hierarchy from the titles. I then exported the structure in .json format.
More data visualizations of the law will be available in the future on my Project Page.
Caveat
Please note – this is merely a beta version of this visualization. Neither the computer code, nor the US code, have been thoroughly tested. Please do not rely on this app for the law as there may be errors or omissions.
There are a few kinks still to work out in terms of color display and layout of the circles.